简单范例
1
2
3
4
5
6
7
8
| import matplotlib.pyplot as plt
import numpy as np
import pandas as pd
index = pd.date_range('20190116', '20190130')
data = [4, 8, 6, 5, 9, 1, 4, 5, 2, 4, 6, 7, 9, 13, 6]
ser_data = pd.Series(data, index=index)
ser_data
|
2019-01-16     4
2019-01-17     8
2019-01-18     6
2019-01-19     5
2019-01-20     9
2019-01-21     1
2019-01-22     4
2019-01-23     5
2019-01-24     2
2019-01-25     4
2019-01-26     6
2019-01-27     7
2019-01-28     9
2019-01-29    13
2019-01-30     6
Freq: D, dtype: int64
1
| ser_data.rolling(3).mean()
|
2019-01-16         NaN
2019-01-17         NaN
2019-01-18    6.000000
2019-01-19    6.333333
2019-01-20    6.666667
2019-01-21    5.000000
2019-01-22    4.666667
2019-01-23    3.333333
2019-01-24    3.666667
2019-01-25    3.666667
2019-01-26    4.000000
2019-01-27    5.666667
2019-01-28    7.333333
2019-01-29    9.666667
2019-01-30    9.333333
Freq: D, dtype: float64
1
| ser_data.rolling(3, min_periods=1).mean()
|
2019-01-16    4.000000
2019-01-17    6.000000
2019-01-18    6.000000
2019-01-19    6.333333
2019-01-20    6.666667
2019-01-21    5.000000
2019-01-22    4.666667
2019-01-23    3.333333
2019-01-24    3.666667
2019-01-25    3.666667
2019-01-26    4.000000
2019-01-27    5.666667
2019-01-28    7.333333
2019-01-29    9.666667
2019-01-30    9.333333
Freq: D, dtype: float64
1
2
3
4
5
6
7
8
9
10
11
12
13
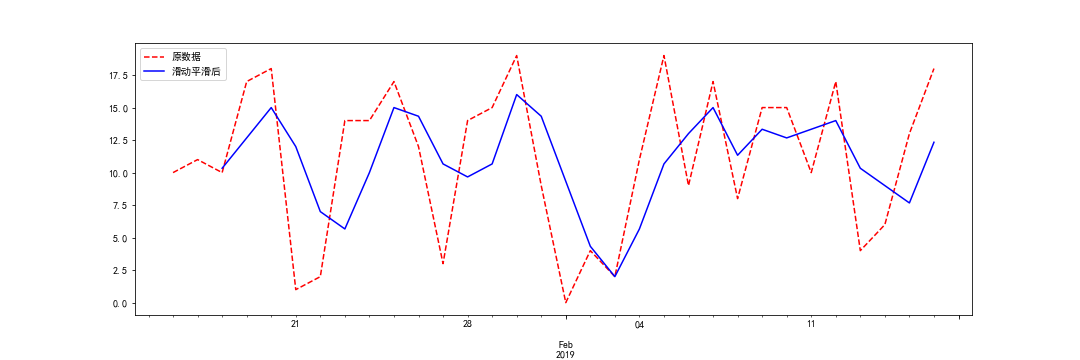
| index = pd.date_range('20190116', '20190216')
data = np.random.randint(20, size=len(index))
ser_data = pd.Series(data, index=index)
plt.figure(figsize=(15, 5))
ser_data.plot(style='r--', label='原数据')
ser_data.rolling(3).mean().plot(style='b', label='滑动平滑后')
plt.legend()
plt.savefig("../img/2019-09-01_Pandas移动窗口.png")
plt.close()
|

参考:
- 移动窗口函数rolling
- pandas 0.17.0 documentation
- python时间序列分析之_用pandas中的rolling函数计算时间窗口数据