两股票历史价格比较
项目任务
- 获取财务数据
- 填充缺失值
- 数据归一化
- 折线图
代码
依赖
1 | import matplotlib.pyplot as plt |
获取财务数据
1 | s_pf = '600000' |
数据处理
1 | df = pd.concat([df_pf.close, df_gd.close], axis = 1, keys = ['pf_clse','gd_close']) |
| pf_clse | gd_close | pf_one | gd_one | |
|---|---|---|---|---|
| pf_clse | 1.000000 | 0.912252 | 1.000000 | 0.912252 |
| gd_close | 0.912252 | 1.000000 | 0.912252 | 1.000000 |
| pf_one | 1.000000 | 0.912252 | 1.000000 | 0.912252 |
| gd_one | 0.912252 | 1.000000 | 0.912252 | 1.000000 |
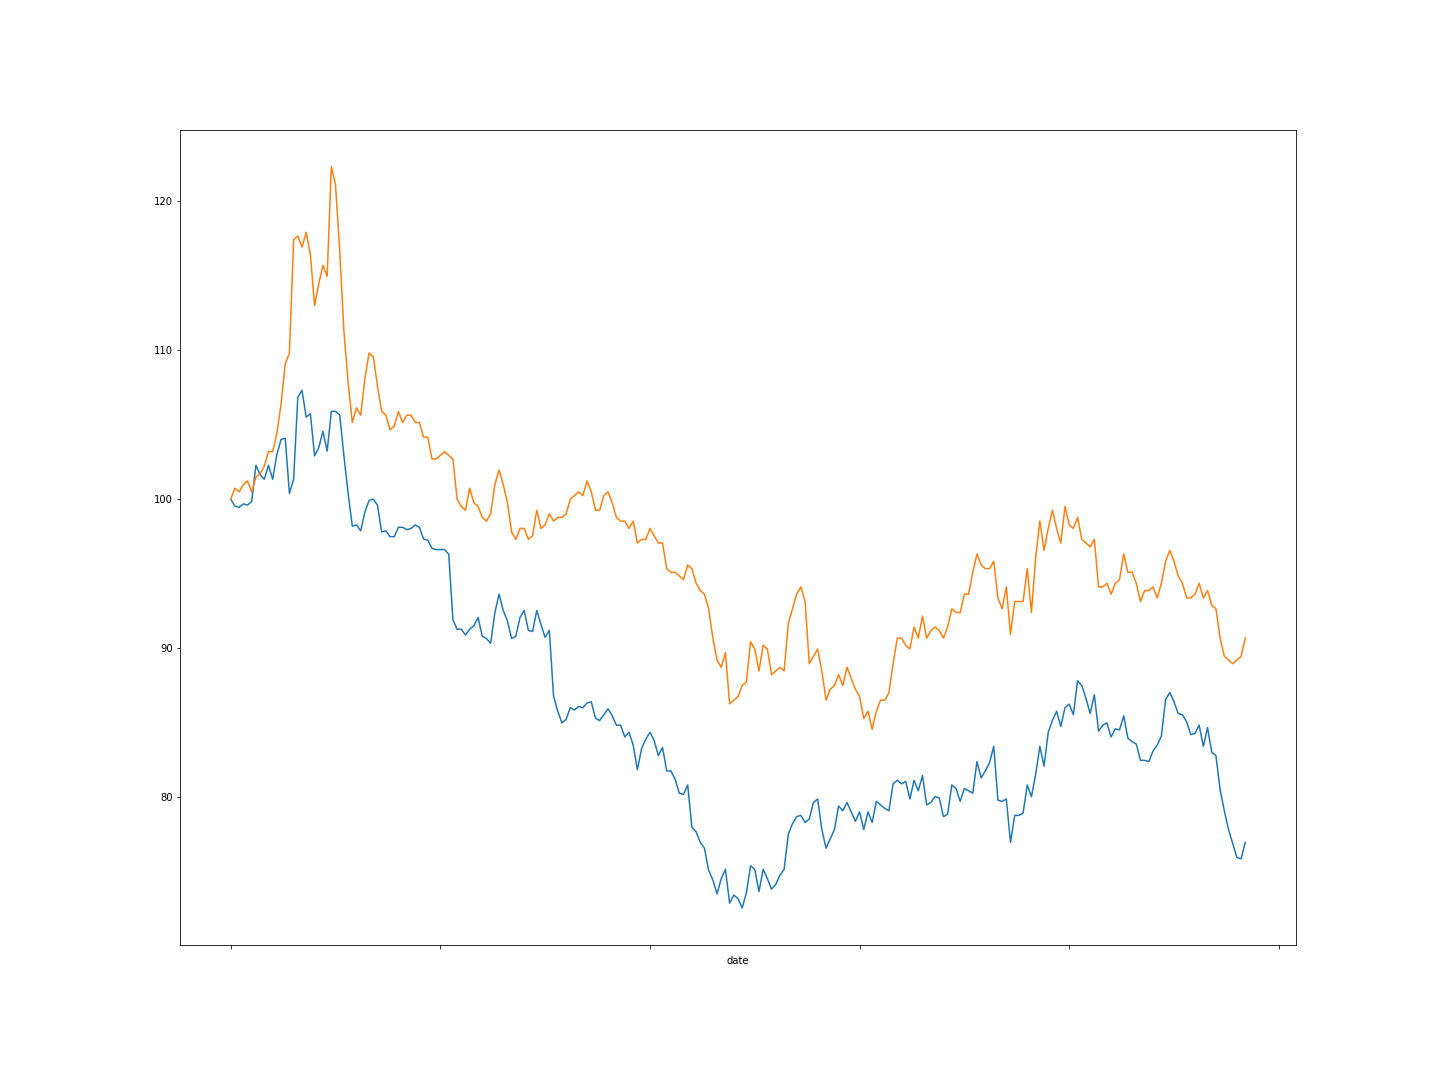
画图
1 | df.pf_one.plot(figsize = (20,15)) |
参考: